One of the disciplines of web development that took us several years to master is the error logs monitoring. When a site or web application runs on a web server, it logs errors when something wrong happens. It's usually buried into server logs where no one is looking! It's like working blind, not knowing what's happening to your web application and to your users.
Let's dive deeper into the benefits of error logs monitoring, and best practices for the implementation and the ongoing management of it.
As I was saying, error logs monitoring is one of the features we implemented that has made the biggest difference in the stability of the web applications we build for us and for our clients.
Why do you need to monitor the error logs?
Even if you have the best specifications, with the best user stories and the best developers, even if you have lots of automated test coverage, there will always be random bugs in any system. Some might be quite minor, but they're usually edge cases from random users not following the standard flow.
When those errors happen, you cannot rely on users to report them or contact your customer service team to complain! At best, users facing these errors won't be able to complete their task. At worst, they will be frustrated and they will never come back to your website.
This is why you need to monitor the errors... so you get to know about those issues in real-time, before your users contact your technical support.
How do you monitor error logs?
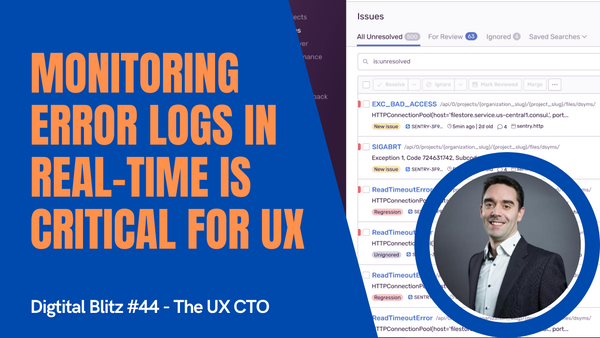
At work, we personally use a tool called SENTRY, but there are plenty of others like Airbrake, Blackfire... there are dozens. It helps you aggregate all the errors in one place. Some of them, some of those tools even identify improvements to be made in your application, such as the long script or the slow database queries.
It's pretty straightforward: just by adding a few lines of code, you can install those libraries in your web application and it automatically sends all the logs to a central dashboard where you can categorise them by severity or by frequency, and then trigger a support ticket or a slack notification, assign that to your team.
What do you do with error monitoring logs?
Once you have visibility over those errors, you can start doing some analysis. Because those tools not only bring all the data in one place, but more importantly, you can see how often they happen, how many users were affected and what piece of code triggered it.
Now that you can identify which one are critical, you need to prioritise them in your product roadmap. It can be a challenge to decide how you allocate the time between fixing a bug from an edge case or a single user versus building a new feature that could benefit thousands of customers.
It's like when we spoke about refactoring in your application, it is critical, it's mandatory that you allocate 10 to 20% of your development budgets to fix those underlying issues. It can only make your web application better and your users happier.
Other disciplines
That's it for today. Remember that what we've just covered today is for web applications, but the same tools can apply for database logs, network monitoring and cloud infrastructure... there's plenty of other disciplines to apply that to.
If you need help with setting up error logs monitoring to your web application or need some support to improve the stability of your digital platform, just get in touch. Don't forget to subscribe to my YouTube channel and follow me on Twitter to keep learning with me and grow your career in digital.
Until next time, stay safe and see you soon.